Welcome back to my blog. So this blog post is about maths and measurement and you already know I like maths so I am posting it. We are doing this measurement topic in maths because we have athletics so we have to train. This athletics activity is about Discus.
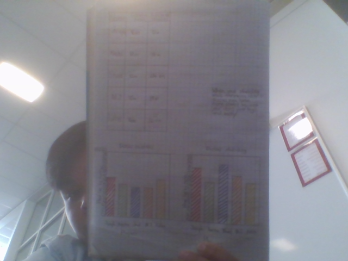
First we had to measure how far we threw on a data. We measured how far we three on knees and standing up with a discus. Our group did pretty good, Joseph had sixteen metres on knees and twenty two metres standing, Karsten had thirteen metres while on knees and sixteen metres standing, Myself got twelve metres on knees and twenty four while standing, M.J. had twelve metres on knees and nineteen metres standing and Tutoe threw sixteen metres while on knees and the same for standing.
Our next step was to create a bar graph for throwing discus on knees and standing. I skipped by two's for both graphs. I also added details into my graph. Last of all I explained how they are different. My explanation is: When your standing while throwing the discus you have more power because your using your legs and body. Also we had to rate our selves from out of five for presentation and effort I gave myself a three out of five in my presentation and four out of five in my effort.
No comments:
Post a Comment
T o support my learning I ask you to comment as follows:
1. Something positive - something you like about what I have shared. 2. Thoughtful - A sentence to let us know you actually read/watched or listened to what I had to say
3. Something helpful - how have you connected with my learning? Give me some ideas for next time or ask me a question