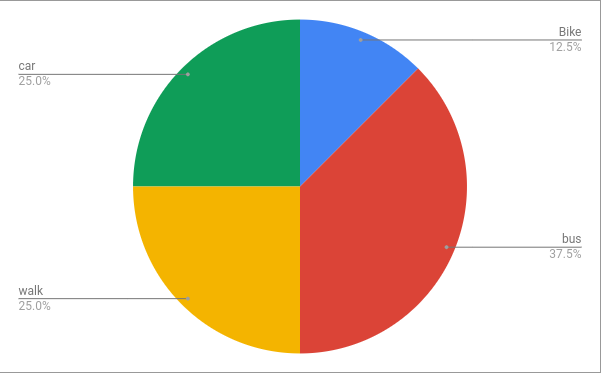
Welcome back to my blog my lovely teacher show us to make a graphs on google sheet. So you can make your own graphs. So first you have to make a google sheet. After you make the google sheet you Put any word you like on the left side end and make sure on the second column you put the numbers on it. After that you put the numbers and the words you highlight it and go to insert and press chart it will come with a bar graph. You can choose any graphs you want but I recommend you choose the pie graphs because it has percentages. Also you can choose which colour you want.

Wow Shadrach,
ReplyDeleteI like your blog post because you are so interested in your learning. I liked how you explained how to do the pie graph on a google sheet and you recommended what graph you liked and how you liked it. Maybe next time you could take a video of you taking step by step instructions.have you use google sheets for this before or did you just find out about how to use graphs in google sheets? Keep up the good work and i look forward to seeing you do more amazing blog post.BYE
Thank you, Quaid I appreciate your positive comment about my pie graphs. And thanks for the thoughtful comment about maybe next time I will try to video my self making the pie graph on google sheet. May be I will try to video my self next time. "Ahhhhh" Miss D just told us how to make a graph in google sheet you can check it in our class blog in maths. Thank you Quaid for your comment.(:.BYE
DeleteThis comment has been removed by the author.
ReplyDelete